Maps
Maps help to people to identify and draw areas geospatially.
When to use a map
Use a map when it makes identifying or drawing areas easier to do.
Maps help people to:
- identify and confirm an area with or without a postal address
- select, draw, edit and delete areas
- compare areas
- identify a feature within an area, for example a building, tree or road
- identify where features share a boundary
You should also provide an alternative to a map if possible, and it is recommended that this be designed first.
Both the map and the alternative to the map should be tested with users.
How it works
We have created in-house maps.
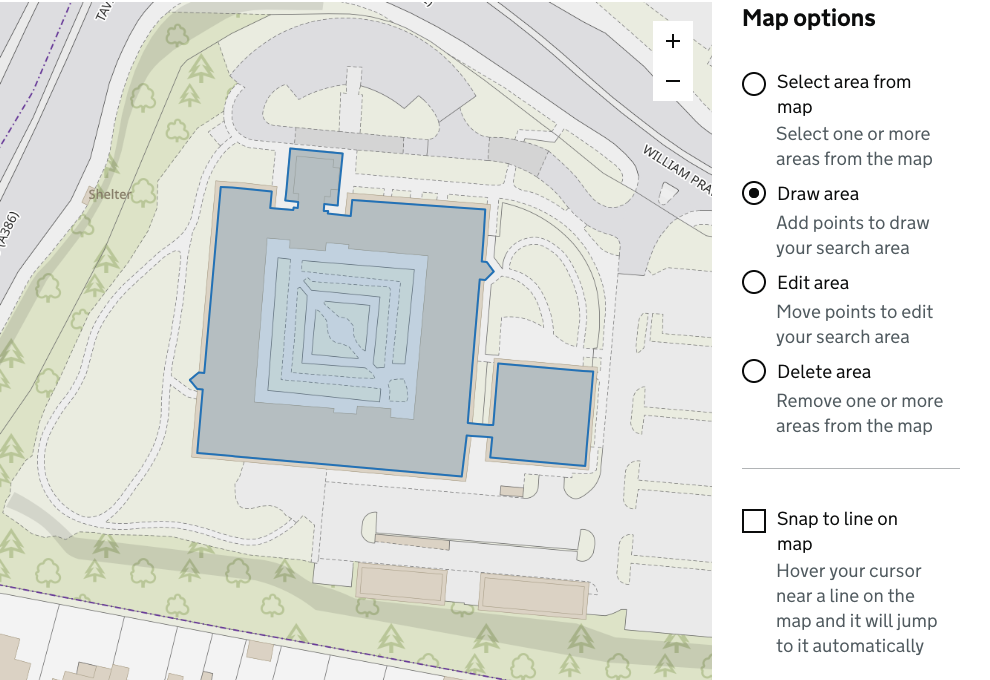
The maps within Search for local land charges and Maintain use the GDS radio buttons for the map options.
Make maps more accessible and easier to use
Map alternatives
Alternatives to a map could include turning geospatial data into textual data, for example:
- describing the area and orientation
- showing the postcode based on the map coordinates
Map alternatives could include:
- providing data in other formats, such as geoJSON
- a search and filter function
Map accessibility
Maps and mapping services do not fall under the accessibility regulations.
Maps can contain accessibility issues and usability can be complex. You should make mapping features as accessible and usable as possible.
Ways to make a map more usable and accessible include:
- simplifying the map options to only those that the user needs
- placing map controls outside of the map
- use vector map tiles to allow for layering and styling of map features
Ordering pages, elements and map options
Organise the order of pages in the service and the order of elements on the page, for example:
- placing a postcode search first
- using a map after a textual address, so that the map is not the primary element if it does not need to be
You can organise the interactive map options in the most usable order, for example:
- have the search and filter tools earlier in the tab order than the map
- investigate separating map controls into basic and advanced options
- present customised help, such as keyboard controls
Textual and semantic elements
Present map options in textual form, this includes:
- using labels instead of icons
- not putting text in images
Add textual descriptions to visually presented elements.
Use the correct semantic elements, including:
- button HTML tags for buttons, not other tags
- GOV.UK Design System components instead of custom ones
Add additional semantic data to elements, including:
- metadata such as microdata or microformats
- HTML attributes or ARIA attributes
Map colours
Present map features in different colours or shading, such as:
- black and white
- high colour contrast (aim for WCAG AAA compliance)
- hatching
See the following examples of map colours:
- ESRI guide to Designing maps for colourblind readability
- Ordnance Survey maps example where the colour palette can be chosen
- Office for National Statistics choropleth census maps
You can use or copy colour schemes developed specifically for this purpose from trusted sources such as Ordnance Survey. Check the use case is the same as yours.
Alternative ways to interact with the map
Explore interacting the map by other ways, for example:
- keyboard
- voice
- filtering, refining a search, or removal of map features
For mouse and touch screen, ensure that touch targets are large enough.
Using a keyboard
Make map options accessible by keyboard, including:
- ensuring the controls can be tabbed to
- that they are in a logical tab order
- investigating methods for selecting features or drawing a boundary, for example, using Web Feature Services (WFS) and selecting a feature at the centre of the map
Common key mappings are:
- arrow keys for panning
- the + and - keys for zoom
- enter or space to select
Key controls, zoom and vector map tiles
Consider including a toggle to show/hide the key controls.
Some JavaScript libraries handle zoom slightly differently. Most zoom the map when the =/+ key is pressed without the need to use the shift key. Openlayers does not do this and the functionality would need to be added.
Use vector map tiles instead of static images.
Remove or reduce the amount of JavaScript
Provide the no script version of the map if JavaScript is unavailable to the user.
Services with maps
The following HM Land Registry services use maps:
- Local land charges; Search for local land charges, Portal, Maintain and Migration helper
- Search for land and property information
- MapSearch within Portal
Get help using maps in your service
Speak to teams with maps in their services.
Collaborate with Government designers on maps. Visit:
- UK Government Digital slack Maps in services channel
- Cross Government slack Maps in services workspace
Learn from other Government departments maps guidance. View:
- GOV.UK Design system backlog: Maps
- DEFRA public wiki page on using interactive maps
- DEFRA Design standards for maps
- DEFRA blogpost, Designing a more accessible flood map
- Digital Land – Map component
- Transport for West Midlands, Map style
Ordnance Survey Labs contains tools and information for using maps.
The GeoDataViz Toolkit contains sections on:
- Using the right basemap
- Cartographic design principles
- Using colours
Help us improve maps and this guidance
If you have feedback on how we can improve this guide, email hmlr-design-system-support@landregistry.gov.uk.